Users who have the Company manage privilege can view statistics about the completion of quizzes.
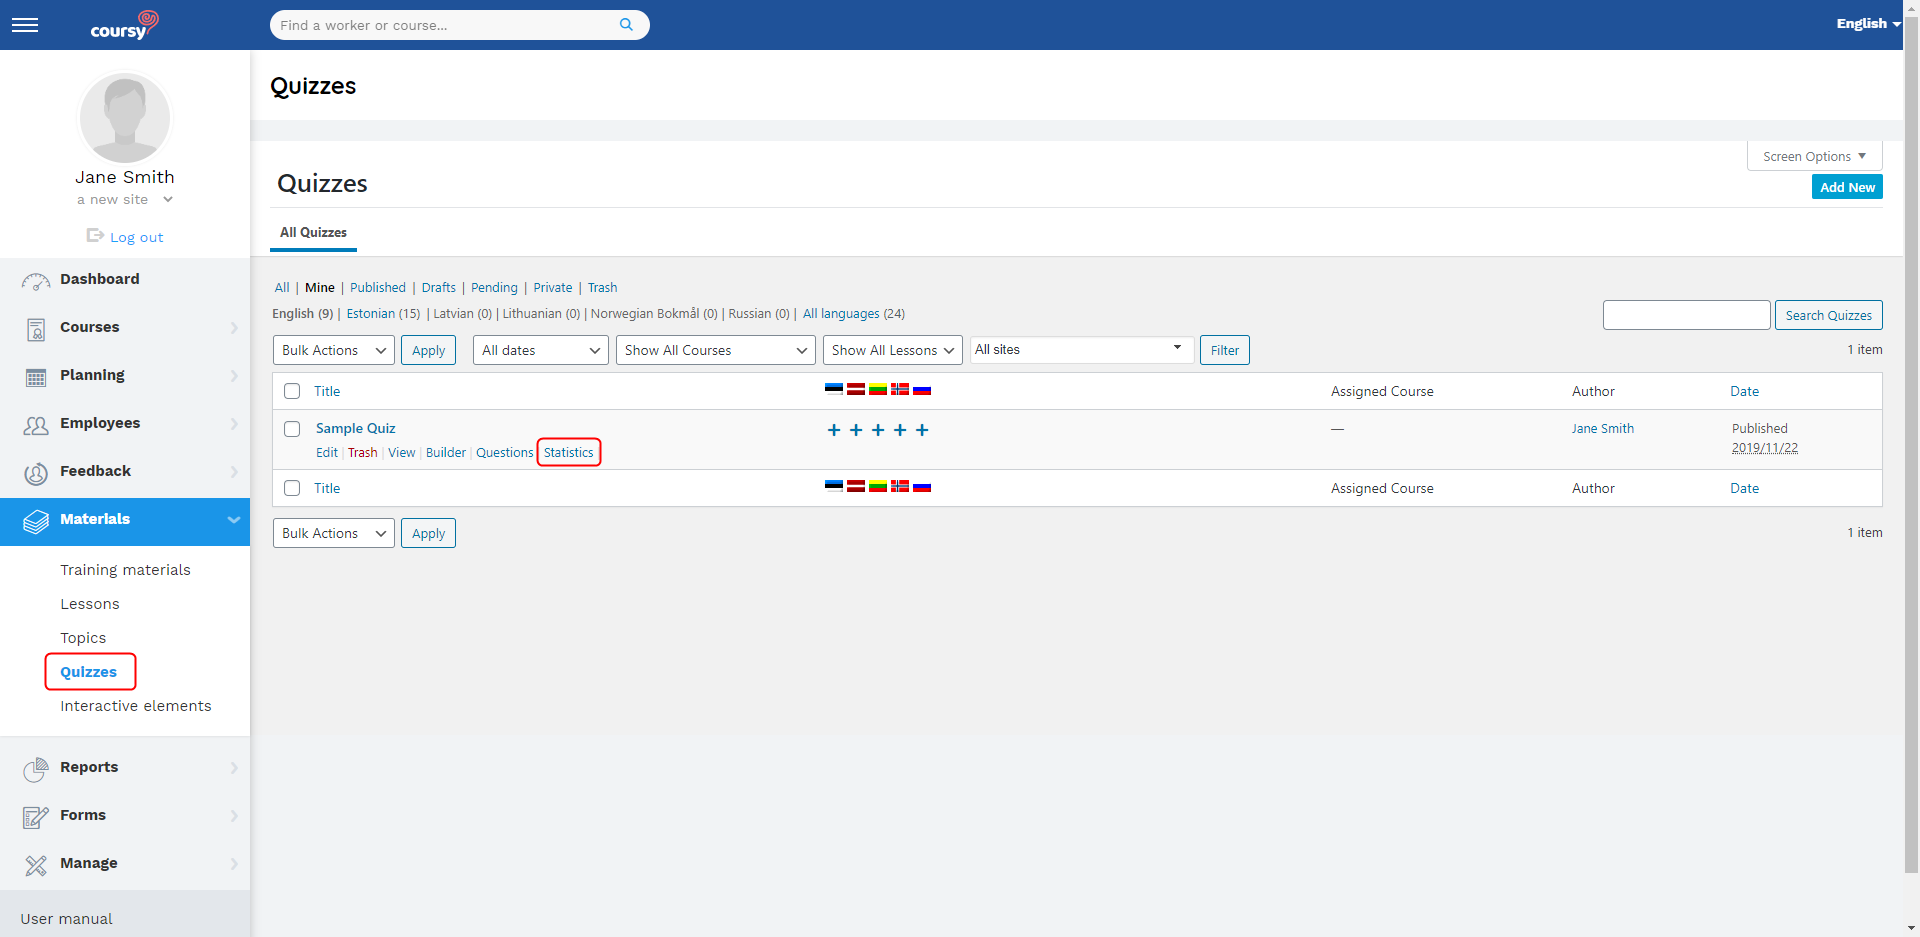
You can open the quiz’s statistics view from the Quizzes’ list view. Hover over the name of the quiz to display the Statistics button.

The statistics of quizzes is of a more general/quantitive nature. For example, you can see how many questions the employee answered correctly, but not which questions were correctly answered.
The statistics view has two tabs: History and Overview.
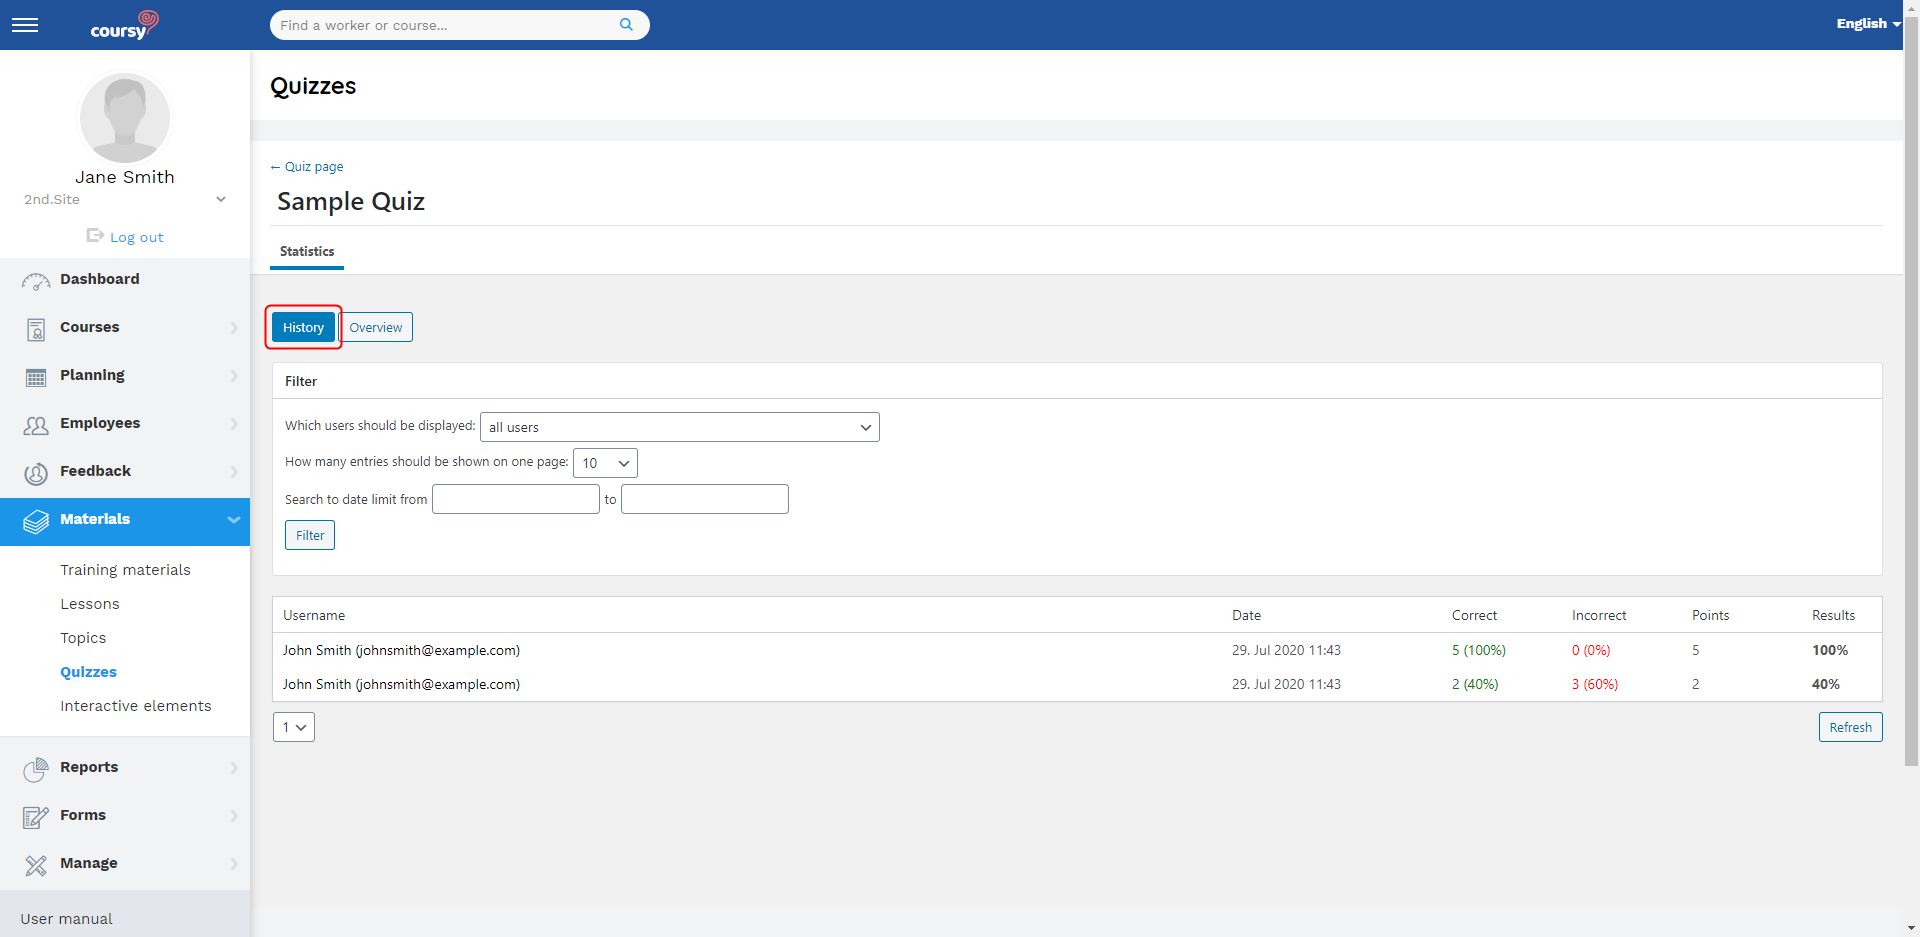
In the History tab, every quiz submission is displayed on a different row. You can filter the entries by the employee or date.
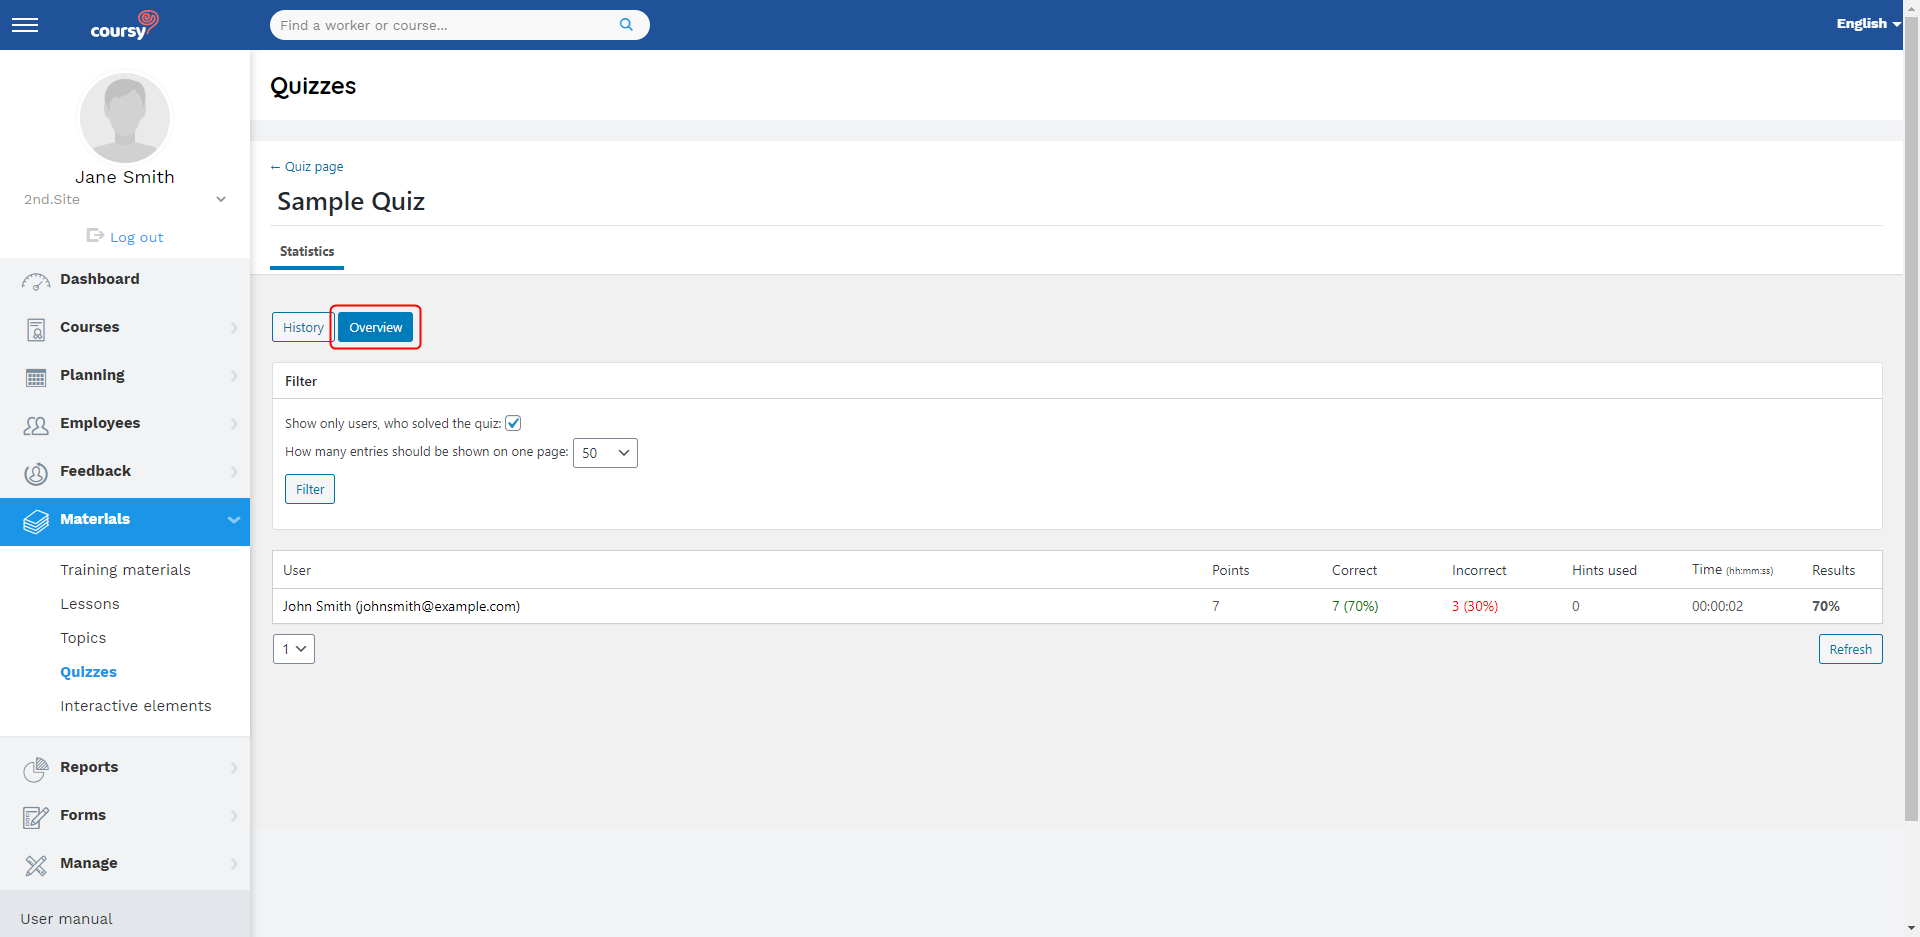
In the Overview tab, you can view the cumulative result of all the employee’s quiz submissions. If the employee has taken the quiz multiple times, then the results of all the submissions are added together. You can use the filter to display only the employees who have taken the quiz.
An example of the statistics:
- The quiz consists of five questions that are all worth 1 point.
- The employee answers two questions correctly and three incorrectly.
- The employee takes the quiz for the second time and answers all five questions correctly.
- In the History tab, you can see the results on two separate rows.
- In the Overview tab, you can see the cumulative result: the employee got altogether 7 points, answered seven questions correctly, and three incorrectly.


